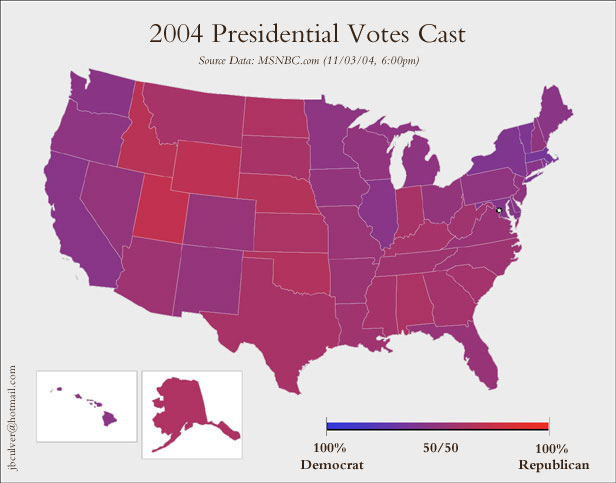
Blended Results By State
Purple-USA.jpg (JPEG Image, 616×483 pixels)
By County
Election 2004 Results
Using County-by-County election return data from USA Today together with County boundary data from the US Census’ Tiger database we produced the following graphic depicting the results. Of course, blue is for the democrats, red is for the republicans, and green is for all other. Each county’s color is a mix of these three color components in proportion to the results for that county.
The whole “red state” view serves the Republicans and the Media and dumbs down the facts. Talking about purple states doesn’t exactly fix the matter, but at least it shows more of the truth — Dems and Reps live everywhere; thank god we’re integrated.
The link below leads to a very different kind of map, a cartogram, which I find harder to digest. mjh